
Most investors know they want to make money from property. Fewer know how to verify that before they buy. If you have ever looked at a rental listing and wondered whether the numbers actually work, you are not alone. Learning how to calculate real estate ROI is the single most useful skill you can develop before investing in any property.
- What Is ROI in Real Estate and Why Does It Matter?
- The Basic ROI Formula for Real Estate
- Step-by-Step Example Using a Residential Property
- Common Mistakes Investors Make When Applying This Formula
- How to Calculate Rental Yield as Part of Your ROI Analysis
- Gross Rental Yield vs. Net Rental Yield: Which Number Should You Use?
- What Counts as a Good Rental Yield Across Different Markets?
- Cash-on-Cash Return: A More Accurate ROI Formula for Leveraged Purchases
- How to Factor in Mortgage Payments and Financing Costs
- Basic ROI vs. Cash-on-Cash Return: A Side-by-Side Comparison
- How to Calculate Investment Returns Over a Multi-Year Hold Period
- Including Property Appreciation in Your Total Return Calculation
- How Equity Buildup Adds to Long-Term Investment Returns
- What Costs Must You Include for an Accurate ROI Calculation?
- Operating Expenses That Most First-Time Investors Overlook
- How to Estimate Costs Before You Buy a Property
- Using a Simple ROI Spreadsheet to Compare Multiple Properties
- Conclusion
This article walks you through the core formulas, real worked examples, and the cost categories you cannot afford to miss. By the end, you will know exactly how to run the numbers on any deal with confidence.
No jargon. No guesswork. Just clear math that helps you make better decisions.
What Is ROI in Real Estate and Why Does It Matter?
Return on investment, or ROI, is the percentage return you earn relative to what you spent to acquire and hold a property. It answers one simple question: for every dollar I put in, how much do I get back?
That question matters most when you are comparing options. Two properties might look similar on the surface, but one might return 6% annually while the other returns 3.2%. Without calculating ROI, you have no way to know which one is actually the better use of your capital.
For investors starting with limited funds, this matters even more. When your initial capital is tight, the cost of a poor decision is higher. A clear ROI calculation removes emotion from the process and replaces it with a number you can stand behind.
How ROI Differs from Other Property Metrics
ROI, gross yield, net yield, and cash-on-cash return are all related, but they are not the same metric.
- Gross yield measures income as a percentage of property value, before any expenses.
- Net yield adjusts that figure for costs, giving you a closer look at real income.
- Cash-on-cash return measures the annual cash income against only the cash you physically invested, not the full property price.
- ROI is the broadest of the four and can account for both income and appreciation over time.
Each one answers a different question. This article covers all of them, starting with the most fundamental formula first.
The Basic ROI Formula for Real Estate
The core formula for real estate ROI is:
ROI = (Net Profit / Total Investment Cost) x 100
Here is what each term means in practice:
Net Profit is the income the property generates after all expenses are subtracted. For a rental property, this is your annual rent collected minus every cost associated with owning and managing that property.
Total Investment Cost is every dollar you spent to acquire the property. This includes the purchase price, closing costs, renovation expenses, legal fees, and any other upfront spending before the property generated a single cent.
The result is a percentage. A 7% ROI means you earned back 7 cents for every dollar invested over the measurement period, typically one year.
Step-by-Step Example Using a Residential Property
Here is a worked example using consistent numbers you will see referenced throughout this article.
Property details:
- Purchase price: $250,000
- Renovation costs: $20,000
- Closing costs and legal fees: $5,000
- Total investment cost: $275,000
Annual income and expenses:
- Gross annual rent: $18,000
- Annual operating expenses (maintenance, insurance, taxes, management): $6,000
- Net annual profit: $12,000
ROI calculation:
ROI = ($12,000 / $275,000) x 100 = 4.36%
That means for every dollar invested in this property, you earned approximately 4.36 cents in the first year. Whether that is acceptable depends on your market, your strategy, and what comparable investments return elsewhere.
Common Mistakes Investors Make When Applying This Formula
The formula itself is simple. The errors come from what people leave out.
Leaving out closing costs is the most frequent mistake. Many first-time investors divide their net income by the purchase price alone, ignoring the additional $5,000 to $15,000 in fees they paid to complete the transaction. This inflates the ROI figure artificially.
Ignoring vacancy periods is another common error. A property sitting empty for six weeks costs you income. If your market has a 5% average vacancy rate, your effective annual rent is not $18,000; it is closer to $17,100.
Confusing gross and net figures when building the formula produces wildly optimistic results. Always confirm whether the income figure you are using is before or after expenses, and do the same for your cost figures.
How to Calculate Rental Yield as Part of Your ROI Analysis
Rental yield focuses specifically on the income a property produces relative to its value. It is the income-side component of a full ROI calculation and one of the most commonly used figures when comparing properties across different locations.
There are two versions:
Gross Rental Yield = (Annual Rent / Property Value) x 100
Using the example property: ($18,000 / $250,000) x 100 = 7.2%
Net Rental Yield = ((Annual Rent – Annual Expenses) / Property Value) x 100
Using the same property: (($18,000 – $6,000) / $250,000) x 100 = 4.8%
Notice the gap between those two figures. That gap represents your real cost of ownership, and it is the number that actually determines what you take home.
Gross Rental Yield vs. Net Rental Yield: Which Number Should You Use?
Both figures serve a purpose, depending on what you are trying to do.
Gross yield is useful for quick comparisons. When you are scanning 10 properties across two cities and want to shortlist the top 3, gross yield provides a quick filter. It requires minimal data and gets you a directional answer quickly.
Net yield is what you use when you are serious about a specific property. It accounts for the real costs of ownership and tells you what the investment actually earns after the bills are paid.
| Metric | Gross Rental Yield | Net Rental Yield |
|---|---|---|
| Formula | Annual Rent / Property Value x 100 | (Annual Rent – Expenses) / Property Value x 100 |
| Expenses included | No | Yes |
| Best used for | Quick market comparisons | Evaluating individual properties |
| Example result | 7.2% | 4.8% |
Never make a final investment decision based on gross yield alone. Use it to filter, then use net yield to decide.
What Counts as a Good Rental Yield Across Different Markets?
Rental yield benchmarks vary significantly by country and city. As a general reference across major English-speaking markets:
- USA: Residential yields typically range from 4% to 10%, with higher yields found in secondary cities like Cleveland or Memphis and lower yields in San Francisco or New York.
- UK: Most major cities land between 4% and 7%, with cities like Manchester and Liverpool historically producing stronger yields than London.
- Canada: Vancouver and Toronto tend toward the lower end, often 3% to 5%, while smaller cities in Alberta or Manitoba can reach 6% to 8%.
- Australia: Sydney and Melbourne yields often sit between 2.5% and 4%, while Brisbane and regional areas can reach 5% to 7%.
A higher yield does not automatically mean a better investment. Markets with strong yields often carry higher vacancy risk, lower capital growth potential, or more management-intensive tenants. Always weigh yield against the broader investment picture.
Cash-on-Cash Return: A More Accurate ROI Formula for Leveraged Purchases
When you use a mortgage to buy a property, the basic ROI formula becomes less useful. It does not account for the fact that you only put in a fraction of the purchase price in cash. That is where cash-on-cash return becomes the better metric.
Cash-on-Cash Return = (Annual Pre-Tax Cash Flow / Total Cash Invested) x 100
Annual pre-tax cash flow is what remains after you collect rent and pay all expenses, including your mortgage repayments. Total cash invested is only the money you physically put in: your down payment, closing costs, and renovation spending.
This metric is especially relevant for investors starting with limited capital, since it measures how hard your actual cash is working, not the full value of the asset.
How to Factor in Mortgage Payments and Financing Costs
Let us use a $300,000 property with a 20% down payment to illustrate this properly.
Cash invested at purchase:
- Down payment (20%): $60,000
- Closing costs and legal fees: $6,000
- Renovation and setup costs: $8,000
- Total cash invested: $74,000
Annual income and outgoings:
- Gross annual rent: $21,600 ($1,800/month)
- Annual operating expenses: $5,400
- Annual mortgage repayments (principal + interest, 30-year term at 7%): $14,340
- Annual pre-tax cash flow: $21,600 – $5,400 – $14,340 = $1,860
Cash-on-cash return:
($1,860 / $74,000) x 100 = 2.51%
That is a modest but positive return on the cash you actually deployed. It also tells you that this property, at current interest rates, is generating a thin margin. A rate change, a vacancy month, or an unexpected repair could push it to neutral or negative.
Basic ROI vs. Cash-on-Cash Return: A Side-by-Side Comparison
Using the same $300,000 property, here is how the two metrics compare:
| Metric | Calculation | Result |
|---|---|---|
| Basic ROI | Net profit / Total property cost x 100 | ~5.4% (based on $300k purchase + costs) |
| Cash-on-Cash Return | Annual cash flow / Cash invested x 100 | 2.51% |
The basic ROI looks better because it treats the full property value as the investment base, including borrowed money. Cash-on-cash return strips that away and shows you the return on what you personally committed.
Neither figure is wrong. Basic ROI gives you a broader view of the investment’s performance. Cash-on-cash return tells you how efficiently your own money is working. Smart investors track both.
How to Calculate Investment Returns Over a Multi-Year Hold Period
Annual ROI snapshots are useful, but property is typically a long-term asset. Holding a property for five to ten years changes the numbers significantly, as rent compounds, expenses stabilise, and the property potentially appreciates.
To capture the full picture, you need to calculate your annualized total return across the full hold period.
Total Return = (Cumulative Net Rental Income + Appreciation Gain) / Total Cash Invested x 100
Then divide by the number of years held to get your annualized figure.
Including Property Appreciation in Your Total Return Calculation
Appreciation is the increase in property value over time. For a conservative estimate, use 3% annual growth on the original property value.
Using the $250,000 example property from earlier:
- Year 1 value: $250,000
- Year 5 value at 3% annual growth: $250,000 x (1.03)^5 = approximately $289,800
- Appreciation gain: $39,800
If you also collected $12,000 net rental income per year over five years, your total rental return is $60,000.
Total five-year return: $60,000 + $39,800 = $99,800
Annualized ROI over five years: ($99,800 / $275,000) / 5 x 100 = approximately 7.26% per year
That is a meaningfully different figure from the 4.36% first-year return calculated earlier, and it illustrates why holding period matters.
One important note: appreciation is not guaranteed. Markets can stagnate or fall. Build your investment case primarily on rental income and treat appreciation as a potential bonus, not a guaranteed component.
How Equity Buildup Adds to Long-Term Investment Returns
Every mortgage payment you make includes a portion that repays the loan principal. Over time, this reduces your debt and increases your equity stake in the property, even if the market value never moves.
Here is a simplified equity schedule for a $300,000 property with a $240,000 mortgage at 7% over 30 years:
| Year | Approximate Loan Balance | Equity (at $300k value) |
|---|---|---|
| 0 | $240,000 | $60,000 |
| 1 | $237,800 | $62,200 |
| 2 | $235,400 | $64,600 |
| 3 | $232,900 | $67,100 |
| 5 | $227,400 | $72,600 |
By year five, your equity has grown by over $12,600 through principal paydown alone, without any price increase. When you eventually sell, that equity converts to cash. It is a genuine, compounding component of your total return.
What Costs Must You Include for an Accurate ROI Calculation?
Underestimating costs is the single most common reason new investors end up with ROI figures that look great on paper but disappoint in practice. Every dollar you forget to include inflates your return and sets you up for a shortfall.
Costs fall into three clear categories:
Purchase costs:
- Property deposit or down payment
- Conveyancing and legal fees
- Inspection and appraisal fees
- Stamp duty or transfer tax (where applicable)
- Loan origination fees
Holding costs (annual):
- Property management fees (typically 8 to 12% of rent)
- Landlord insurance
- Council and municipal rates or property taxes
- Maintenance and repairs
- Vacancy allowance
- Capital expenditure reserve
Exit costs:
- Agent or realtor commission (typically 2 to 6% of sale price)
- Legal fees for sale
- Capital gains tax on profit
Include all three categories in every ROI calculation. Leaving out even one line item can shift your final figure by a full percentage point or more.
Operating Expenses That Most First-Time Investors Overlook
Beyond the obvious costs, three categories consistently catch new investors off guard.
Vacancy allowance is income you did not earn because the property was empty. A realistic vacancy rate sits between 5% and 8% of annual gross rent in most markets. On $18,000 annual rent, that is $900 to $1,440 per year, you should subtract before calculating net income.
Capital expenditure (CapEx) reserve covers major repairs and replacements: roofing, plumbing, appliances, and HVAC systems. A standard reserve is 1% to 2% of the property value per year. On a $250,000 property, that means setting aside $2,500 to $5,000 annually.
Landlord insurance is separate from standard home insurance and covers risks specific to rental situations, including tenant-related damage, loss of rent due to damage, and liability claims. Annual premiums typically range from 0.5% to 1% of property value.
Build all three into your model before you buy, not after.
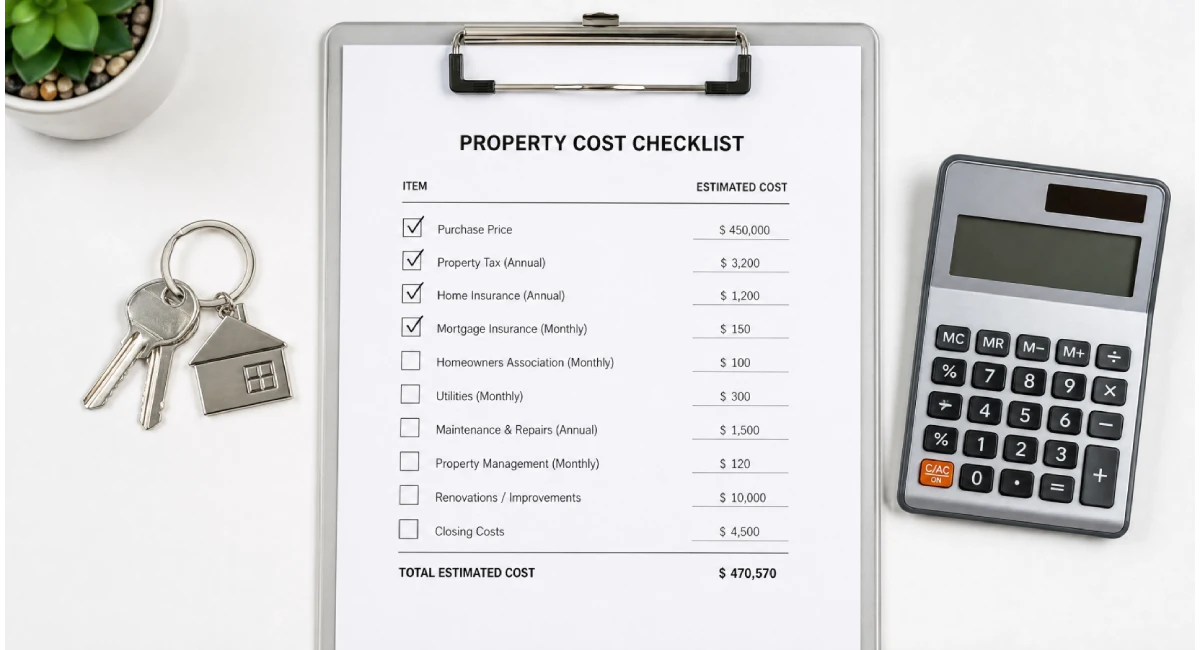
How to Estimate Costs Before You Buy a Property
You do not need to wait until you own a property to run accurate numbers. Here is how to research costs in advance:
- Property tax rates: Search the local council or municipal authority website for the area you are considering. Most jurisdictions publish their rate schedules publicly.
- Property management fees: Contact two or three local property management companies and request a fee schedule. Most will respond quickly.
- Landlord insurance: Get an online quote using the approximate property value. This takes less than ten minutes and gives you a usable figure.
- The 50% rule as a quick check: A widely used heuristic suggests that operating expenses on a rental property will equal roughly 50% of gross rent. So if a property rents for $1,800 per month, expect around $900 in monthly expenses before your mortgage payment. This is a rough filter, not a final calculation, but it is a reliable way to quickly screen out properties with thin margins.
Use these estimates to build a preliminary ROI model before you spend a single dollar on due diligence.
Using a Simple ROI Spreadsheet to Compare Multiple Properties
Once you know the formulas, the most practical step is putting them into a comparison spreadsheet. This removes gut feeling from the process and lets the numbers do the work.
Set up your spreadsheet with these columns for each property:
| Column | What to Enter |
|---|---|
| Purchase Price | Full asking or agreed price |
| Down Payment | Cash deposit amount |
| Renovation Costs | Estimated or confirmed spend |
| Closing and Legal Costs | Estimated total |
| Total Cash Invested | Sum of down payment + renovation + closing costs |
| Gross Annual Rent | Market rent x 12 |
| Annual Operating Expenses | All holding costs combined |
| Annual Mortgage Payment | Based on the loan amount and interest rate |
| Net Annual Cash Flow | Rent minus expenses minus mortgage |
| Basic ROI | Net profit / Total investment cost x 100 |
| Cash-on-Cash Return | Net cash flow / Total cash invested x 100 |
With this structure, adding a new property takes less than five minutes. The comparison becomes immediate and objective.
A Worked Comparison of Two Investment Properties
Here is how two real-world style properties compare when you run every formula covered in this article.
Property A: Stable market, higher price
- Purchase price: $420,000
- Total cash invested: $100,000
- Gross annual rent: $24,000
- Annual expenses: $8,000
- Annual mortgage payments: $14,400
- Net cash flow: $1,600
| Metric | Property A |
|---|---|
| Basic ROI | 3.8% |
| Cash-on-Cash Return | 1.6% |
| Gross Rental Yield | 5.7% |
| Net Rental Yield | 3.8% |
Property B: Higher-yield secondary market, lower price
- Purchase price: $195,000
- Total cash invested: $52,000
- Gross annual rent: $18,600
- Annual expenses: $6,500
- Annual mortgage payments: $10,200
- Net cash flow: $1,900
| Metric | Property B |
|---|---|
| Basic ROI | 5.9% |
| Cash-on-Cash Return | 3.65% |
| Gross Rental Yield | 9.5% |
| Net Rental Yield | 6.2% |
Property B wins on every income metric. However, Property A is in a market with historically stronger capital growth. If your strategy prioritises income, Property B is the clear choice. If you are playing a ten-year appreciation game, Property A may deliver more on a total-return basis.
This is exactly what the spreadsheet is for. The numbers do not decide for you, but they make the right decision much easier to see.
Conclusion
Knowing how to calculate real estate ROI is not an advanced skill. It is a foundational one. The investors who consistently make good property decisions are not smarter than everyone else; they just run the numbers before they commit.
Use the basic ROI formula to establish a headline figure. Cross-check it with the rental yield to understand the income side clearly. Switch to cash-on-cash return when a mortgage is involved. Then build your full cost list and pressure-test everything in a comparison spreadsheet.
Before you evaluate your next property, come back to the formulas in this article and run through each one. If the numbers hold up under scrutiny, you have a deal worth taking seriously. If they do not, you have just saved yourself from an expensive mistake.
For more on building a property portfolio from a small starting point, read the full guide on starting in real estate with limited capital.